The story behind the F-14-map “Where have all the Tomcats gone”
Have you ever wondered what happened to the 712 F-14 Tomcats that were built between 1970 andn1992?
Several of them were lost in crashes or scrapped due to structural failures during service. Most of the aircraft were scrapped after the retirement of the Tomcat in 2006 because of the fear that parts could end up in Iran to keep their F-14 fleet airworthy.
But some 140 survived and are still out there. In Iran, there are still 12 to 50 (depending on the sources) airworthy Tomcats.
Click Here and check out the project of a map with all the remaining Tomcats, the crash sites, and the historic sites.
But whatnkind of geek does it take to set up a map with more than 400 markers thatnrepresent the life of a 50-year-old plane, a plane that he hasn’t ever seen innreal life? Let’s start from the beginning…
Thenhuman dimension (for the human-geeks)
(For thentechnical dimension see below (for the geek-geeks))
A little boy, fascinated by aviation and living in Luxembourg (Europe) … (Luxembourg??? … heard about it, but where is that??? Here!)… , buys on a holiday in South France a little “matchbox” plane with sweep wings … cool stuff in the early 1980s.
During thenperiod of deepest cold war in the early 1980s, this boy plays with his little (as he later found out) Tomcat, fighting the “evil”.
Later henwas given an Aviation-history-book with 500 pages that becomes his favouritenbook. He is lying on the floor, looking in it with big eyes to the technicalndetails and pictures (no, reading wasn’t his thing).
He sees a picture of a US Navy plane landing on a carrier and he recognizes the sweep wings of the toy plane. He compares it with the images in the book and discovers… “Oh…so it is an F-14?!”!
“The Final Countdown” … “looks like an F-14!” … “Top Gun” … “wow… that’s an F-14 too!” … Pictures on the wall, building some models… Growing up, studying, working, marrying, childing … and the passion fades and the time passes.
In 2016 “Hachette Collections” (a weekly magazine where you get parts to build a Tomcat-model) comes with a 1:32 F-14 Tomcat with moving parts …!!! HOW COOL IS THAT!!!
After 2nyears of collecting, building and reading (the magazines filled 5 binders, andnhe reads EVERYTHING, because suddenly, reading became his thing), the 1:32 Tomcatnwas finished and the passion had grown again!
But since henhas not seen a Tomcat in real life yet, he wonders: where is the nearest one?
He isnworking for the local administration and maps and geodata are his business, so henputs some markers on “Google Earth”.
He startsnreading, searching more and putting the data together… YES.. indeed … thensimple idea of a map with the location of the remaining Tomcats, escalated anbit …
So todaynthe map shows all the places where you can find Tomcats, where they were built,nwhere they crashed, and where they made history. Every spot is accompanied withndata, pictures, documents, statements and stories of all kinds.
But why allnthis work (“meaningless” for some)?
The answernis passion! Trying to find out something, needing to know everything, sharingnit with others…and …to be with YOU … and other geeks …talking about our belovednTOMCAT!
You can even join the Facebook group dedicated to the map and getting in touch with other Tomcat-geeks.
There are stillnmany unknown crash sites, parts or even entire aircraft that are undiscoverednand we need your help, experiences and memories …before they fade!
Keep thenmemory of the F-14 Tomcat alive!
… and no … that “little boy” still hasn’t seen any Tomcat innreality yet.
The technical dimension (for the geek-geeks)
A littlen“How to” to collect data, combine them with locations and share them.
The “F-14non display “
The name isna bit confusing because some are in restricted areas and aren’t displayed to thenpublic.
The base of this dataset was the list from the “F-14 Tomcat Association”-homepage. Unfortunately, it hasn’t been kept up to date for a long time because of staff problems.
I combined it with the data from Aerial Visuals and Warbird Registry.
At the beginning I used “Google Earth” fornpointing them on the map and kept the lists in Excel.
Quite quickly I wanted to combine thencoordinates and the different alphanumeric data in one dataset.
I imported all the Excel-data to Access andnlinked them together via the BUNO as key. As output I had one big table withnall the information fields.
Then I imported all the locations into a shapefile with QGIS and linked the Access file too. By linking the shapefile and the Access file in QGIS, I could display the data. And so, the map was born!
To complete the information of the different fighters, I added the data from Home of the M.A.T.S., The Grumman F-14 Tomcat Reference Work website, although this data has not been updated for a long time too. Adding it was particularly difficult because I had to copy the data page by page to Excel and then transform it to have the BUNO on every line. But this work was very useful because it turned out important for the later “crash sites”-part.
After that, I imported the spots as KML to “Google Earth Pro desktop” and I checked one by one on the aerial pictures. “Google Earth” is faster than Google maps and you may also compare with older aerial pictures. This is easy with the outside standing Tomcats. The ones that are inside, I had to compare with the pictures and maps from the museum sites, internet pictures etc … and I tried to move them to the exact position inside the building.
At some point I couldn’t get any further because there were many contradictions. As mentioned before, I live in Luxembourg and my research had shown that the nearest Tomcat is about 5000km/3000miles away. So, I couldn’t check by myself. I needed the help of the Tomcat community to check on site. In addition, other people would probably be interested in the dataset as there was no current public list of all Tomcats.
So, I had to find a way to share the map. After some searching, I discovered that “Google MyMaps” was perfect for this task. I could export my data from QGIS into KML and import it directly to MyMaps.
During thenearly phase I had to make a lot of modifications and so I kept the data in QGISnand imported the entire dataset to MyMaps on every update. But after some time,nI decided to edit the data directly in MyMaps. So today the main database is innMyMaps and I only do regularly backups to KML-files which can easily benimported to Googleearth, Qgis etc..
Then“F-14 related Sites“
This section is a collection of POIs that I addedngradually.
The „F-14 Crash Sites and Mishaps“
During my researches I discovered a lot of pictures and films of crashes and mishaps and I wanted to add them in some way. Especially Aviation Safety Network inspired me to go further.
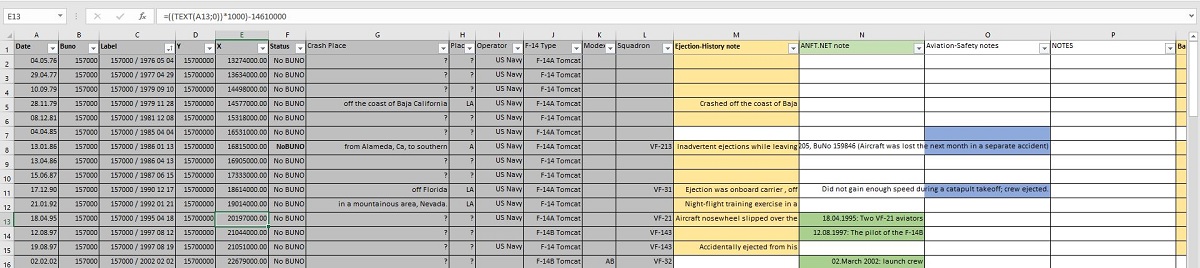
I importednthe data like before and combined it with the prementioned “Home of the MATS”-list.nAfter some very tricky “filter and sorting” by date and BUNO I could againngenerate one list with one presumed crash per line. A lot of guessing andncomparing…!
After thenlist was completed, I checked line per line (some 200) and searched fornlocation indications in the text. Sometimes there were exact locations, likenthe Yuma-Crash site with coordinates from “Home of the MATS”, but most werenlike “in the Atlantic”. So I copied this location indications into the “CrashnPlace”-Field and made an “Place-Status”-Field, in which I evaluated thisnlocation in following categories:
“OK” :nfor “Known”, an exact location, like coordinates
“A” :nfor “Area”, a small area, like “near El Centro”
“LA” :nfor “large Area”, a large area, liken“into the Atlantic”
“?” :nfor “unknown”, without any indications
After thatnI had to place all the spots one by one on the map.
Herenit became REALY TRICKY !!! only for NERDY-GEEK-GEEKS
How to put somethingnon a map without any location indication?
So, whatnare relevant information in the dataset?
- Thenidentification of the Tomcat : The BUNO
- ThenCrash-date
- ThenCrash-location
- Thenprecision of the location indication
The data with “known location” would be displayed:
- onnthe presumed right spot
- withna marker in the colour, corresponding to the “Place-Status”
- withna Label with the BUNO and the crash date ex: “1XXXXX / YYYY MM DD”
The data “withoutnlocation”:
To find somethingnin such a dataset, you would search for a BUNO or the “Crash date”. So, theynshould be displayed in a logical way to find them. I tried to put them in a Cartesianncoordinate system with the “Crash Date” on the “X-axis” and the BUNO on the “Y-axis”n
- withna “?” marker because the location is unknown
- withna Label with The BUNO and the crash date ex: “15XXXX / YYYY MM DD”
Sometimesnthe BUNO wasn’t known. But because I couldn’t leave the field empty I usedn“157000” for unknown BUNO’s.
But I didnnot want to put the spots one by one, but “automatically”?
So, I made ancalculated transformation in Excel.
Tonunderstand the transformation, you need to know that I used a local coordinatensystem. It is a simple XY-System with 1 millimetre as unit and its centrensomewhere in north of France. The values that I added in the formulas were selectednby “try and fail”. It went quite quickly and I got the result I wanted. Sonplease do not ask me for scientific explanations for the chosen values, there arennone!
I searched on Google maps for an area with a lot of space where I wouldn’t place “regular” spots.
The Antarctic sea was be perfect for this.
To make thencalculation as easy as possible, I chose, after analysing the data (see below),nthe following range:
X: 10959000nto 25569000
Y :n15700000 to 16500000
Here is thenreasoning:
- X-axis:nCrash Date
- FirstnCrash : 03.12.1970
- Lastnpossible crash : 04.11.2006
- So,nthe range would be : 01.01.1970 to 31.12.2010
- Converting the date to text innExcel: 25569 to 40179
(01/01/1900 = Day #1; 02/01/1900 = Day #2; 03/01/1900 = Day #3…
So, … 01.01.1970 = Day #25569 and 31.12.2010 = Day #40179 …)
- Tonenlarge the display area, I multiplied it by 1000
- To “move” the area to annempty space over the sea, I subtracted 14610000
- Here is the formula I usednto transform the Date (in column A) to the X-Coordinate : =((TEXT(A2;0))*1000)-14610000
- So, the X coordinates would be 10959000 to 25569000
- Y-axis : BUNO
- First BUNO : 157980
- Last BUNO: 164604
- So, the range would be 157000 to 16500
- To enlarge the display area, I multiplied it by 100
- So, the Y-coordinates would be 15700000 to 16500000
All I hadnto do then was to apply this formulas on every line of my “crash-site-table”, importnit in QGIS as csv-file and then export it into a KML-file in QGIS, which may bendirectly imported to MyMaps.
After thatnI attributed symbols and colours to the different “Place-Status”’s and thennplaced manually one-by-one on the map using the text from the “Crash Place”.
After that,nonly the “unknown Crash places” remained in the “Cartesian coordinate system” .
To makensearching easier I added a grid with labels, which I created the same way asnthe crash sites.
Photo by Marc Wolff and Google MyMaps